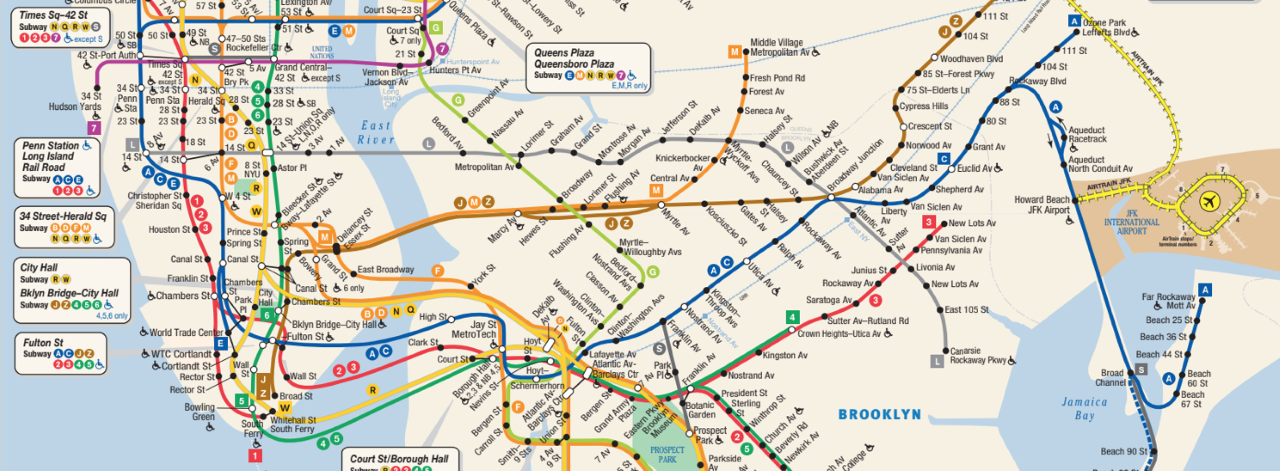
Via statistical analysis, we were able to find the following results for each line regarding whether subway stations had an influence on land value:
H0: This is the null hypothesis. It will act as our parameter through a hypothesized value that suggests that there is no statistical significance or relationships in a set of observations.
d: This is our alpha level. It shows us the statistical level of significance through a threshold value. Common alpha levels include 0.10, 0.05, 0.01, and 0.001.
p: This is our p-value, a conditional probability. It tells us how likely it is that the data would have occurred by random chance. The lower the p-value, the more statistically significant the data is. It is not the probability that the null hypothesis is true. If the p-value is lower than our alpha level, we reject the null hypothesis. If the p-value is higher than or equal to our alpha level, we fail to reject our null hypothesis.
1 Line – Since our alpha level d = 0.05 and our p-value is lower than alpha, we reject H0. This shows us convincing evidence that there is an increase in the average price of land close to 1 Line subway stations compared to the price of land that is 0.25 miles away from these subway stations. Therefore, there is evidence that supports the idea that land close to 1 Line subway stations is more valuable than land that is 0.25 miles away from these subway stations.
7 Line – Since our alpha level d = 0.05 and our p-value is lower than alpha, we reject H0. This shows us convincing evidence that there is an increase in the average price of land close to 7 Line subway stations compared to the price of land that is 0.25 miles away from these subway stations. Therefore, there is evidence that supports the idea that land close to 7 Line subway stations is more valuable than land that is 0.25 miles away from these subway stations.
G Line – Since our alpha level d = 0.10 and our p-value is higher than alpha, we fail to reject H0. This is not convincing evidence that there is an increase in the average price of land close to G Line subway stations compared to the price of land that is 0.25 miles away from these subway stations. Therefore, there is no evidence that supports the idea that land close to G Line subway stations is more valuable than land that is 0.25 miles away from these subway stations.
N Line – Since our alpha level d = 0.10 and our p-value is lower than alpha, we reject H0. This shows us convincing evidence that there is an increase in the average price of land close to N Line subway stations compared to the price of land that is 0.25 miles away from these subway stations. Therefore, there is evidence that supports the idea that land close to N Line subway stations is more valuable than land that is 0.25 miles away from these subway stations.
L Line – Since our alpha level d = 0.05 and our p-value is lower than alpha, we reject H0. This shows us convincing evidence that there is an increase in the average price of land 0.25 miles away from L Line subway stations compared to the price of land that is close to these subway stations. Therefore, there is evidence that supports the idea that land close to L Line subway stations is LESS valuable than land that is 0.25 miles away from these subway stations.

